Latest Trends For Composite Price Indices Diverge In May
CCRSI RELEASE – June 2021
(With data through May 2021)
Print Release (PDF)
Complete CCRSI data set accompanying this release
This month's CoStar Commercial Repeat Sale Indices (CCRSI) provides the market's first look at commercial real estate pricing trends through May 2021. Based on 1,468 repeat sale pairs in May 2021, and more than 244,665 repeat sales since 1996, the CCRSI offers the broadest measure of commercial real estate repeat sales activity.
CCRSI National Results Highlights
-
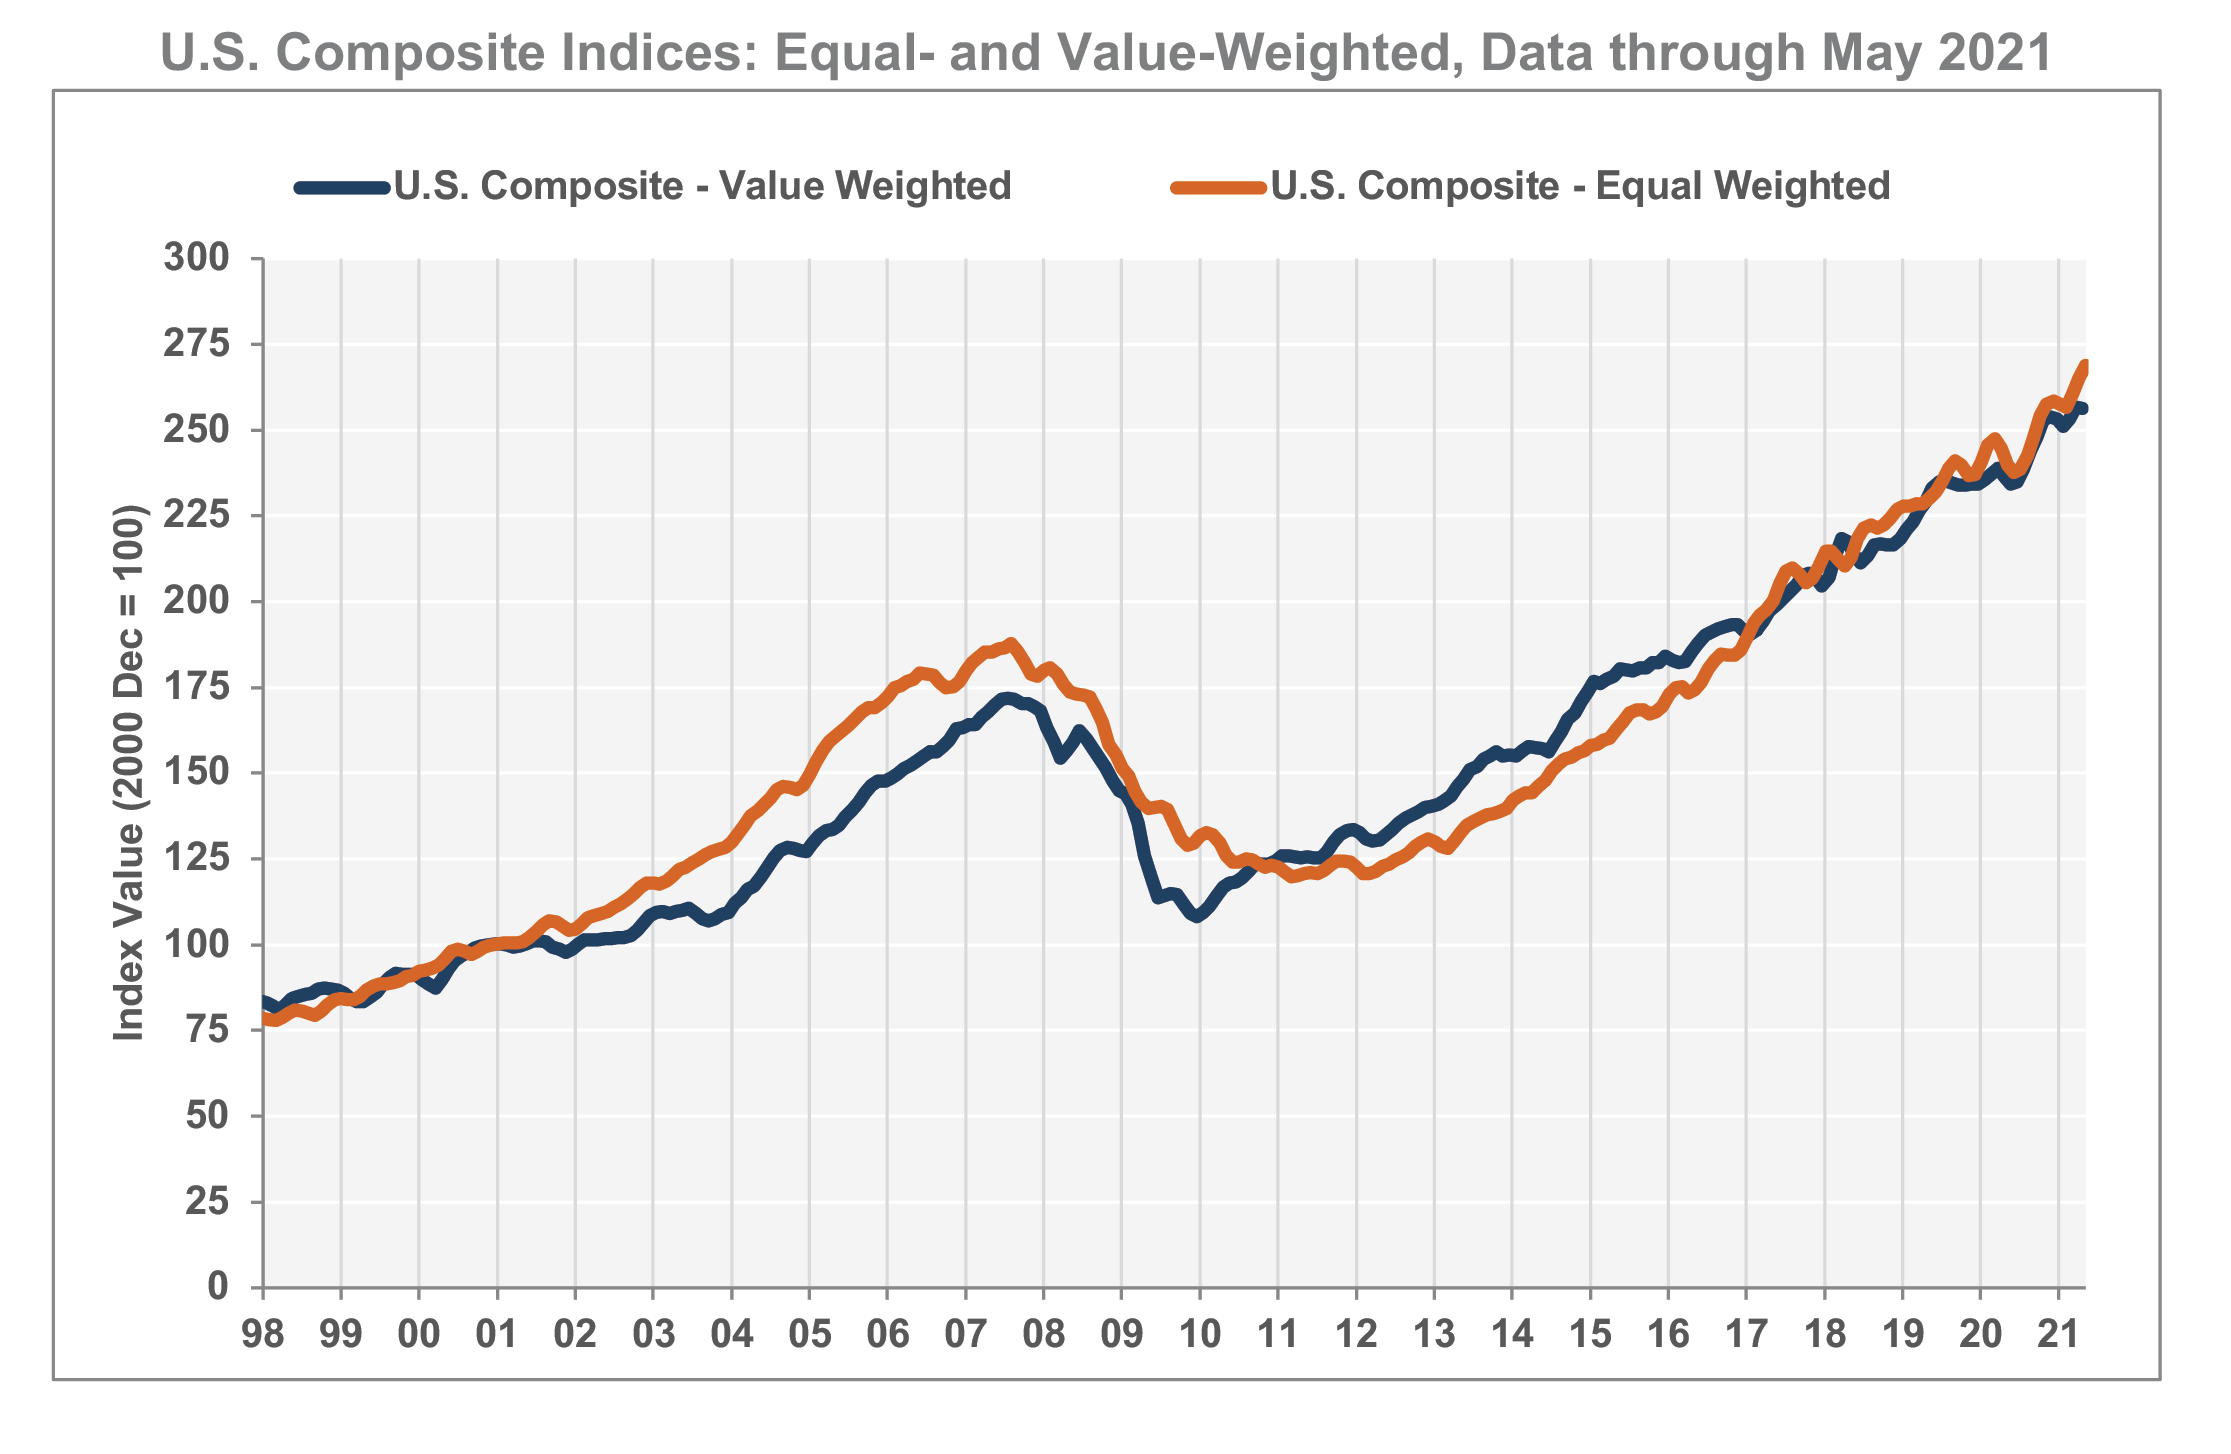
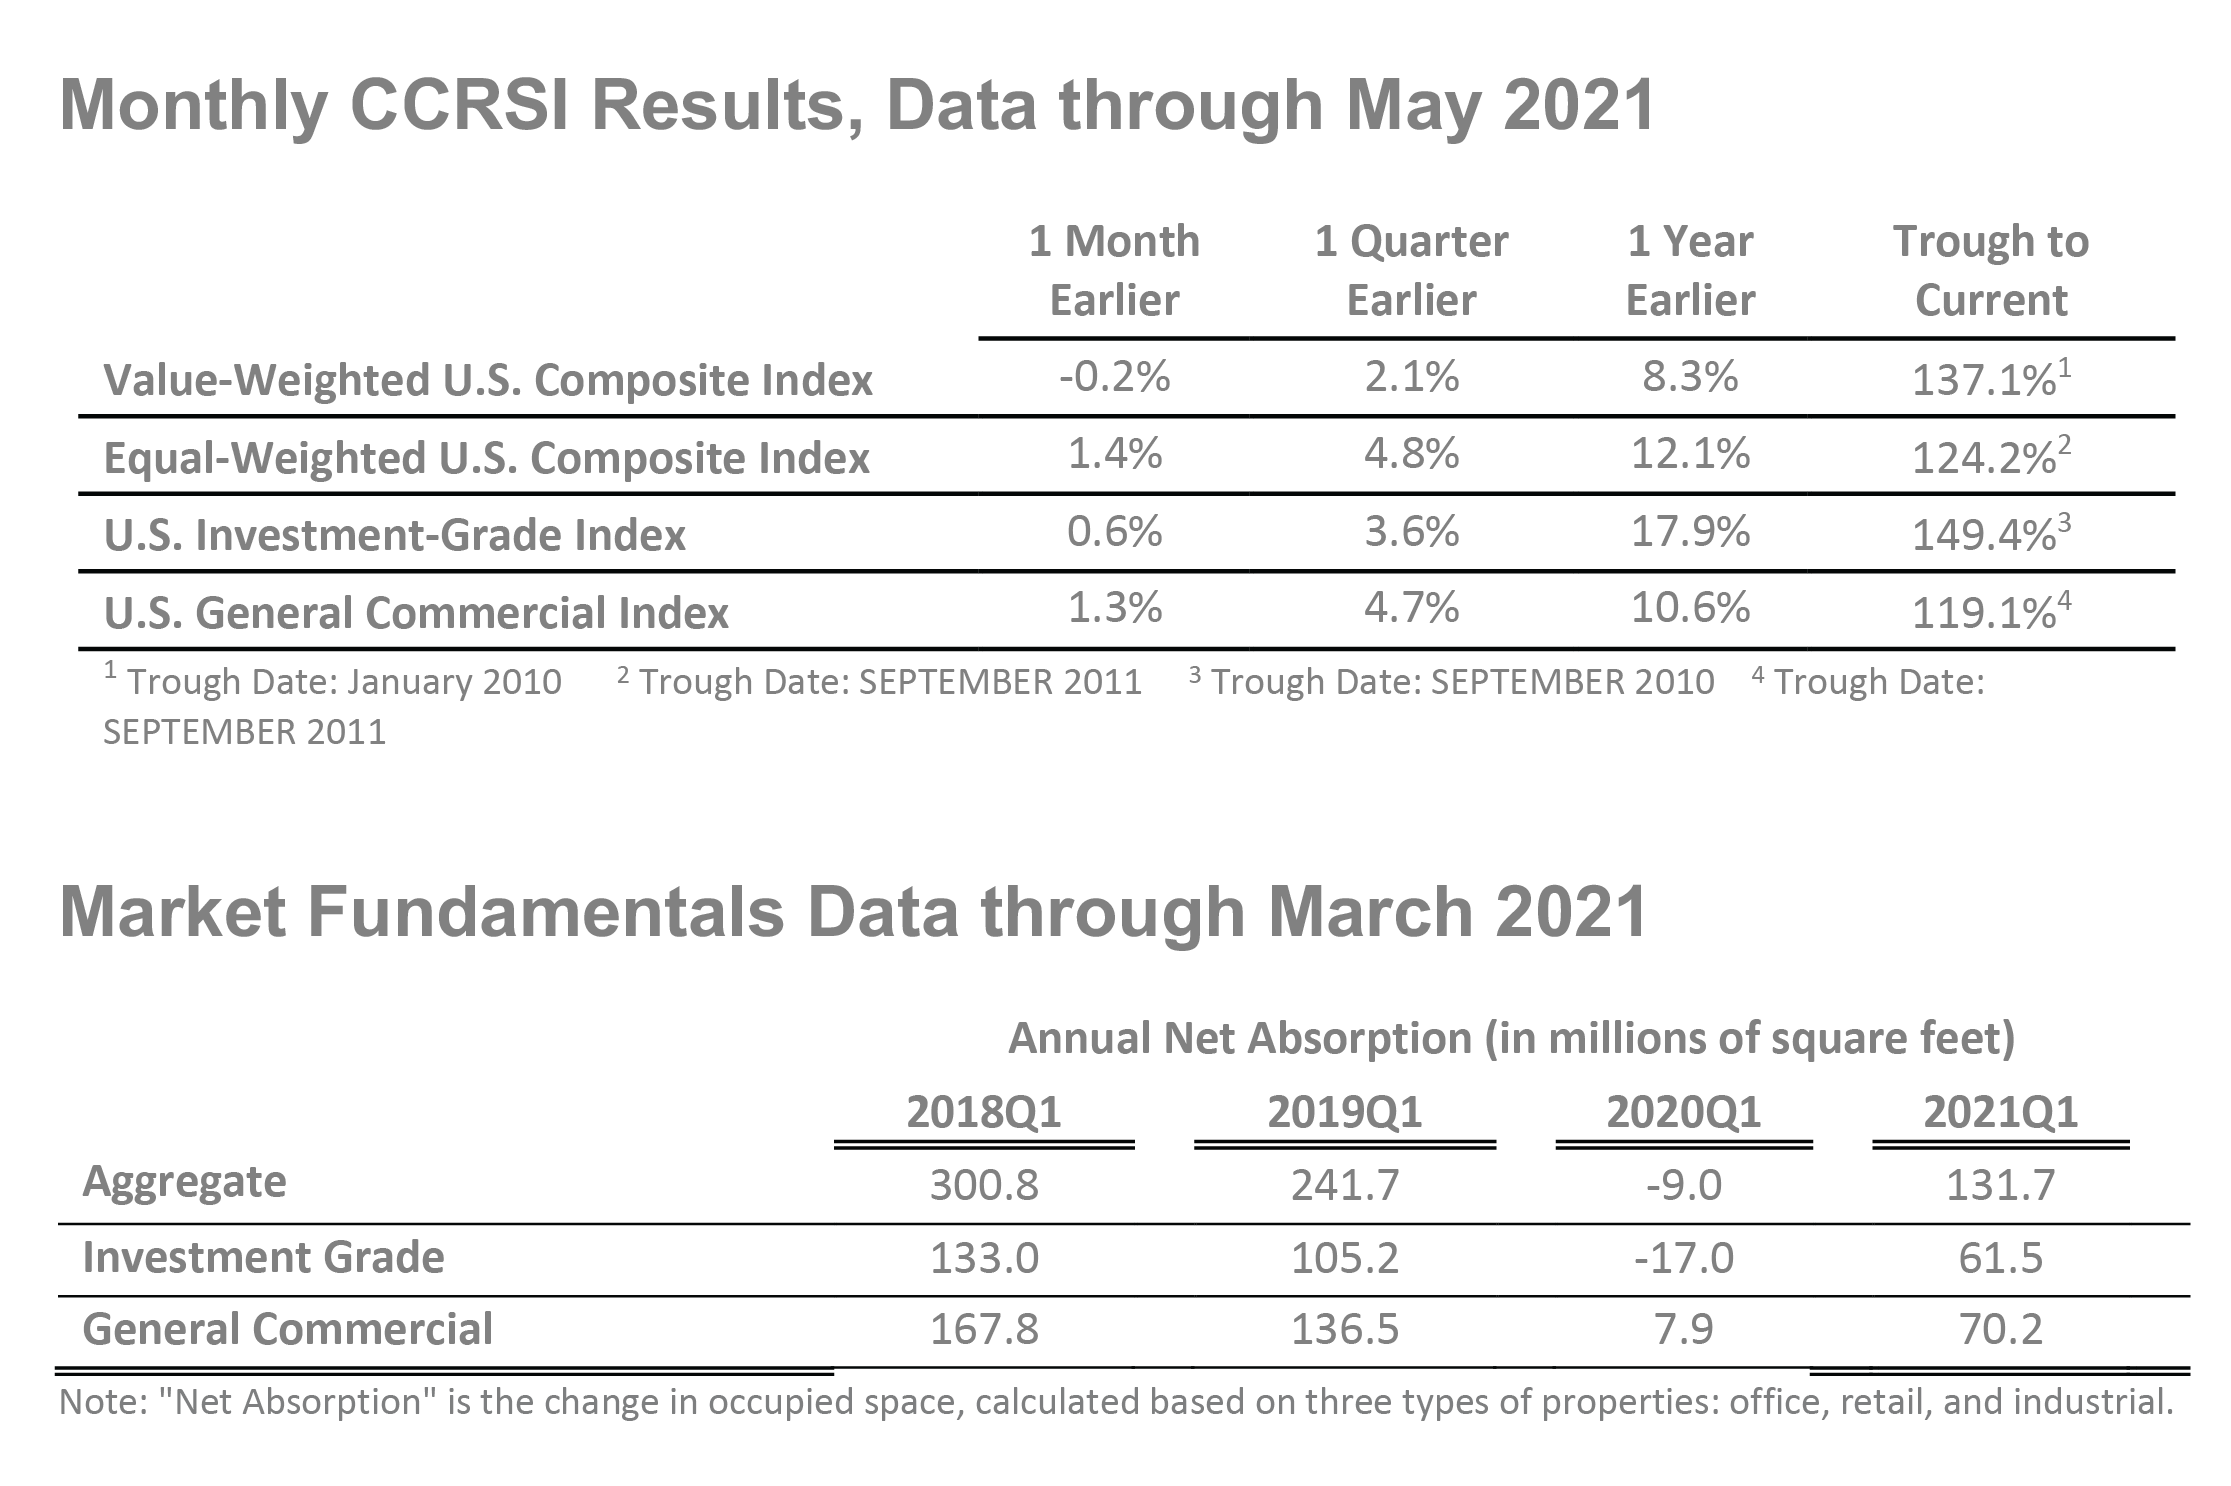
COMPOSITE PRICE INDICES DIVERGED IN MAY. The value-weighted U.S. Composite Index, which is more heavily influenced by high-value trades, declined by 0.2%, stalling after gains in March and April. In contrast, the equal-weighted U.S. Composite Index, which reflects more numerous but lower-priced property sales typical of secondary and tertiary markets, rose by a sharp 1.4%, the third consecutive monthly gain of one percent or more. As property prices recover from the early days of the pandemic, the equal-weighted index increased by 12% in the 12-month period that ended in May 2021, while the value-weighted index increased by 8% over the same period.
-
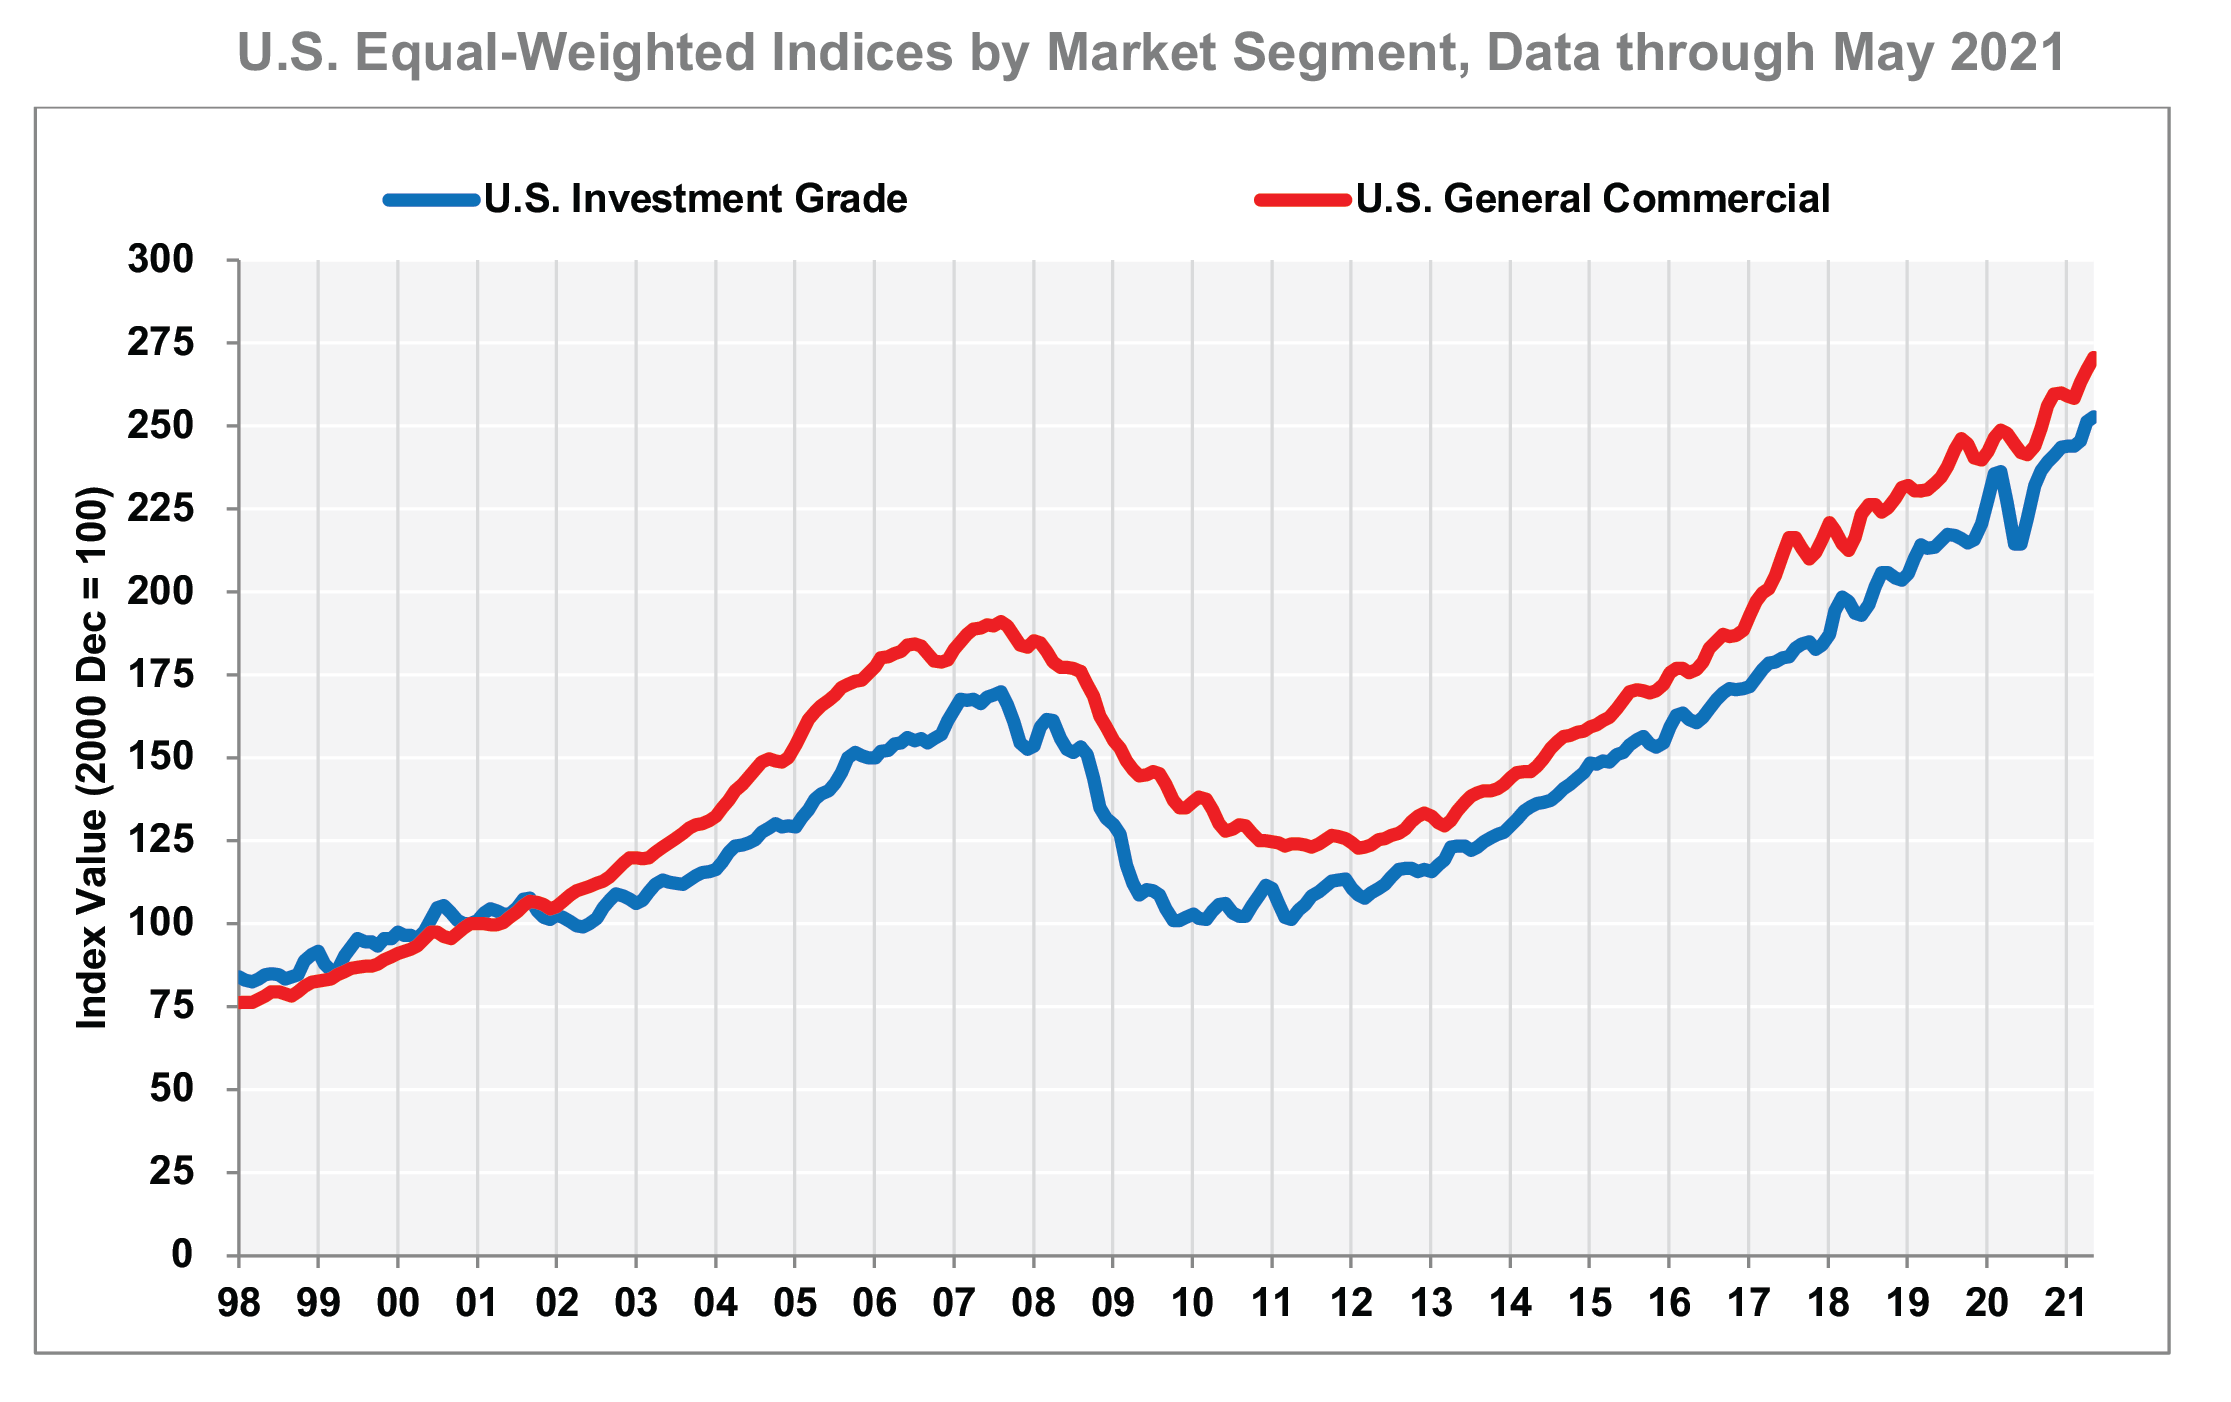
SUB-INDICES OF EQUAL-WEIGHTED INDEX GAINED IN MAY. The two subindices of the equal-weighted U.S. Composite Index posted gains in May 2021. The General Commercial segment, which is influenced by smaller, lower-priced properties, increased by 1.3% in May 2021. This is the third consecutive month of gains of one percent or greater. The General Commercial segment was up by 11% in the 12-month period that ended in May 2021, and was once again at a historical peak after some brief weakness to start 2021. The Investment Grade segment, which is influenced by higher-value properties, rose by 0.6% in May 2021, also setting a new historical peak, and was up by 18% over the 12-month period that ended in May 2021. Higher-value properties experienced greater declines in May 2020, which made the 12-month change comparison more favorable for the Investment Grade segment in May 2021.
-
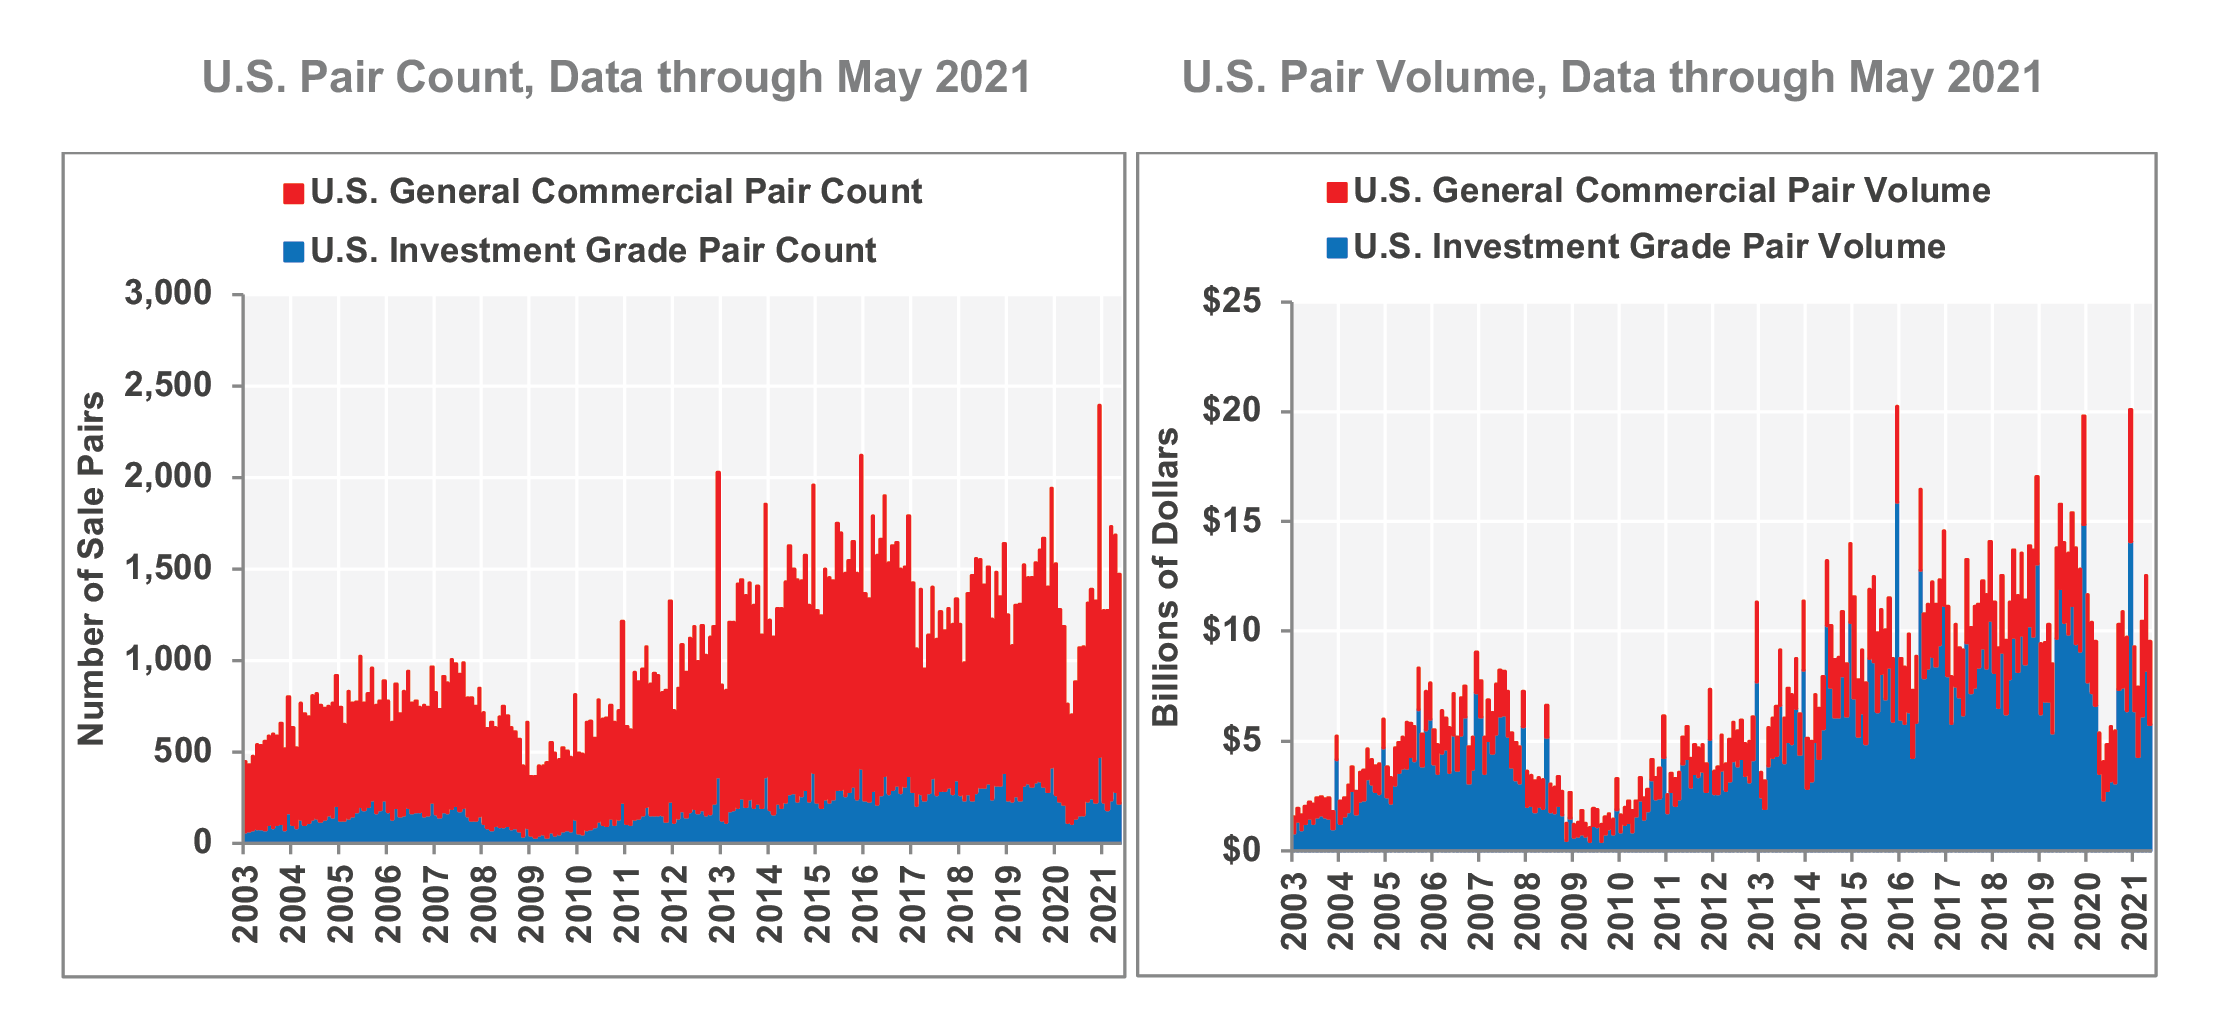
TRANSACTION VOLUME IMPROVED FROM LOW LEVELS. Composite pair volume of 16,879 trades for the 12-month period that ended May 2021 marked the highest trailing 12-month total since the pandemic hit in March 2020. The number of transactions for the first five months of 2021 is 36% greater than the first five months of 2020 and 15% greater than the first five months of 2019, representing a good sign for the return to typical liquidity conditions.
-
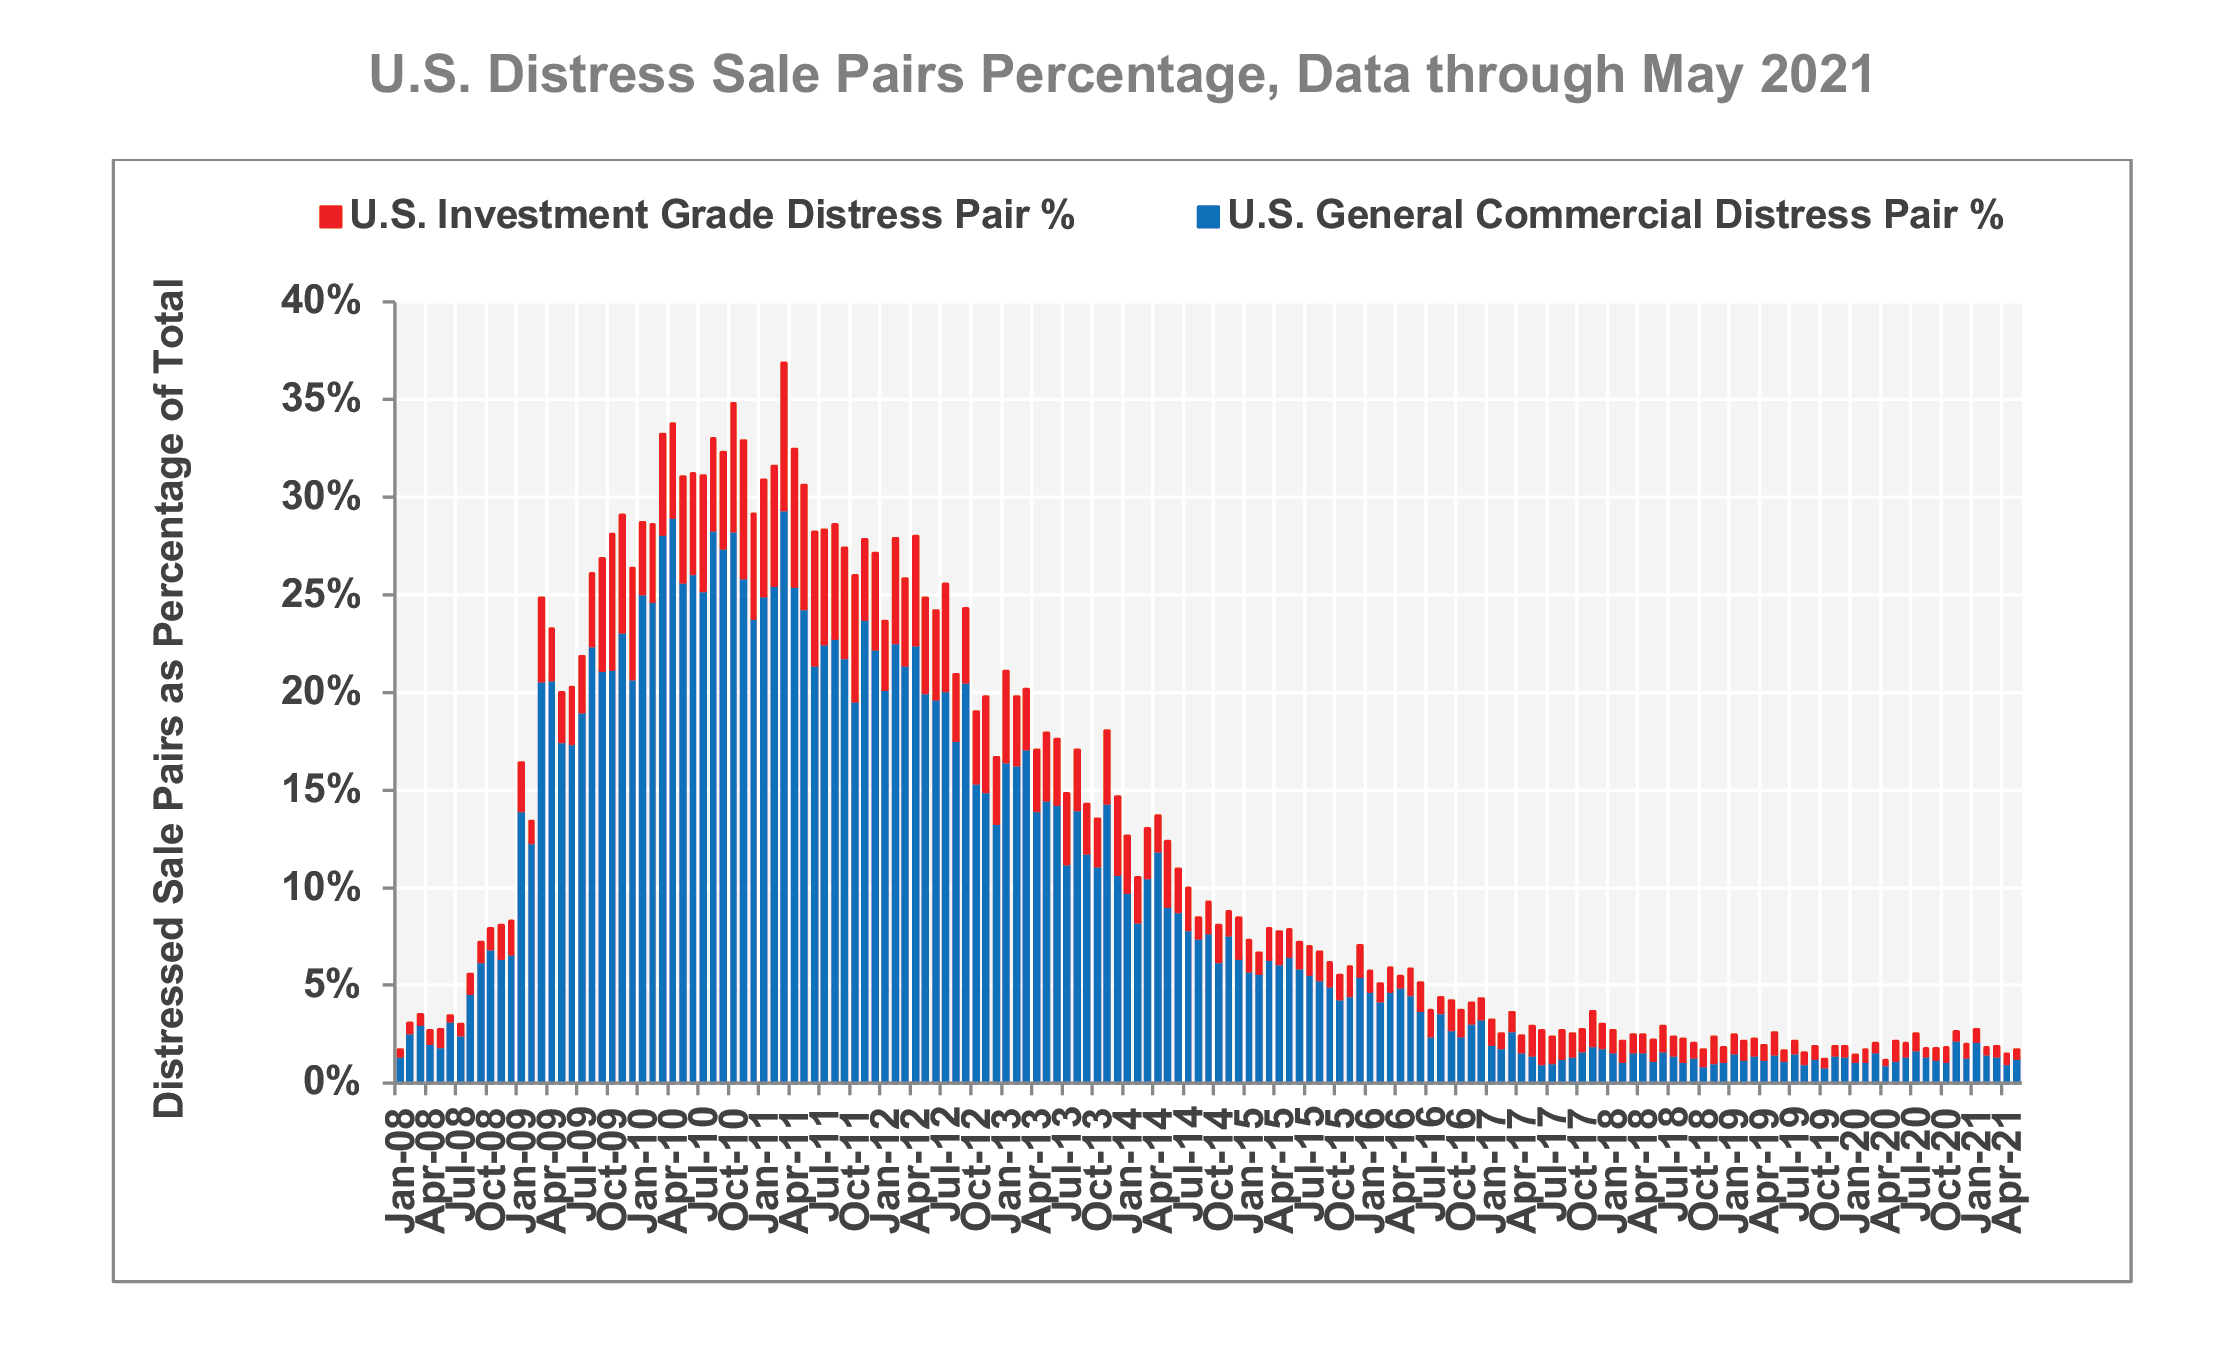
THE SHARE OF REPEAT-SALE TRADES THAT WERE DISTRESSED REMAINED LOW. General Commercial and Investment Grade distressed sales remained 1.3% and 0.4%, respectively, of total trades in May 2021. Both rates are low compared to their five-year averages of 1.6% and 0.9%, respectively. The continued low share of distressed sales demonstrates relatively healthy liquidity conditions.
-
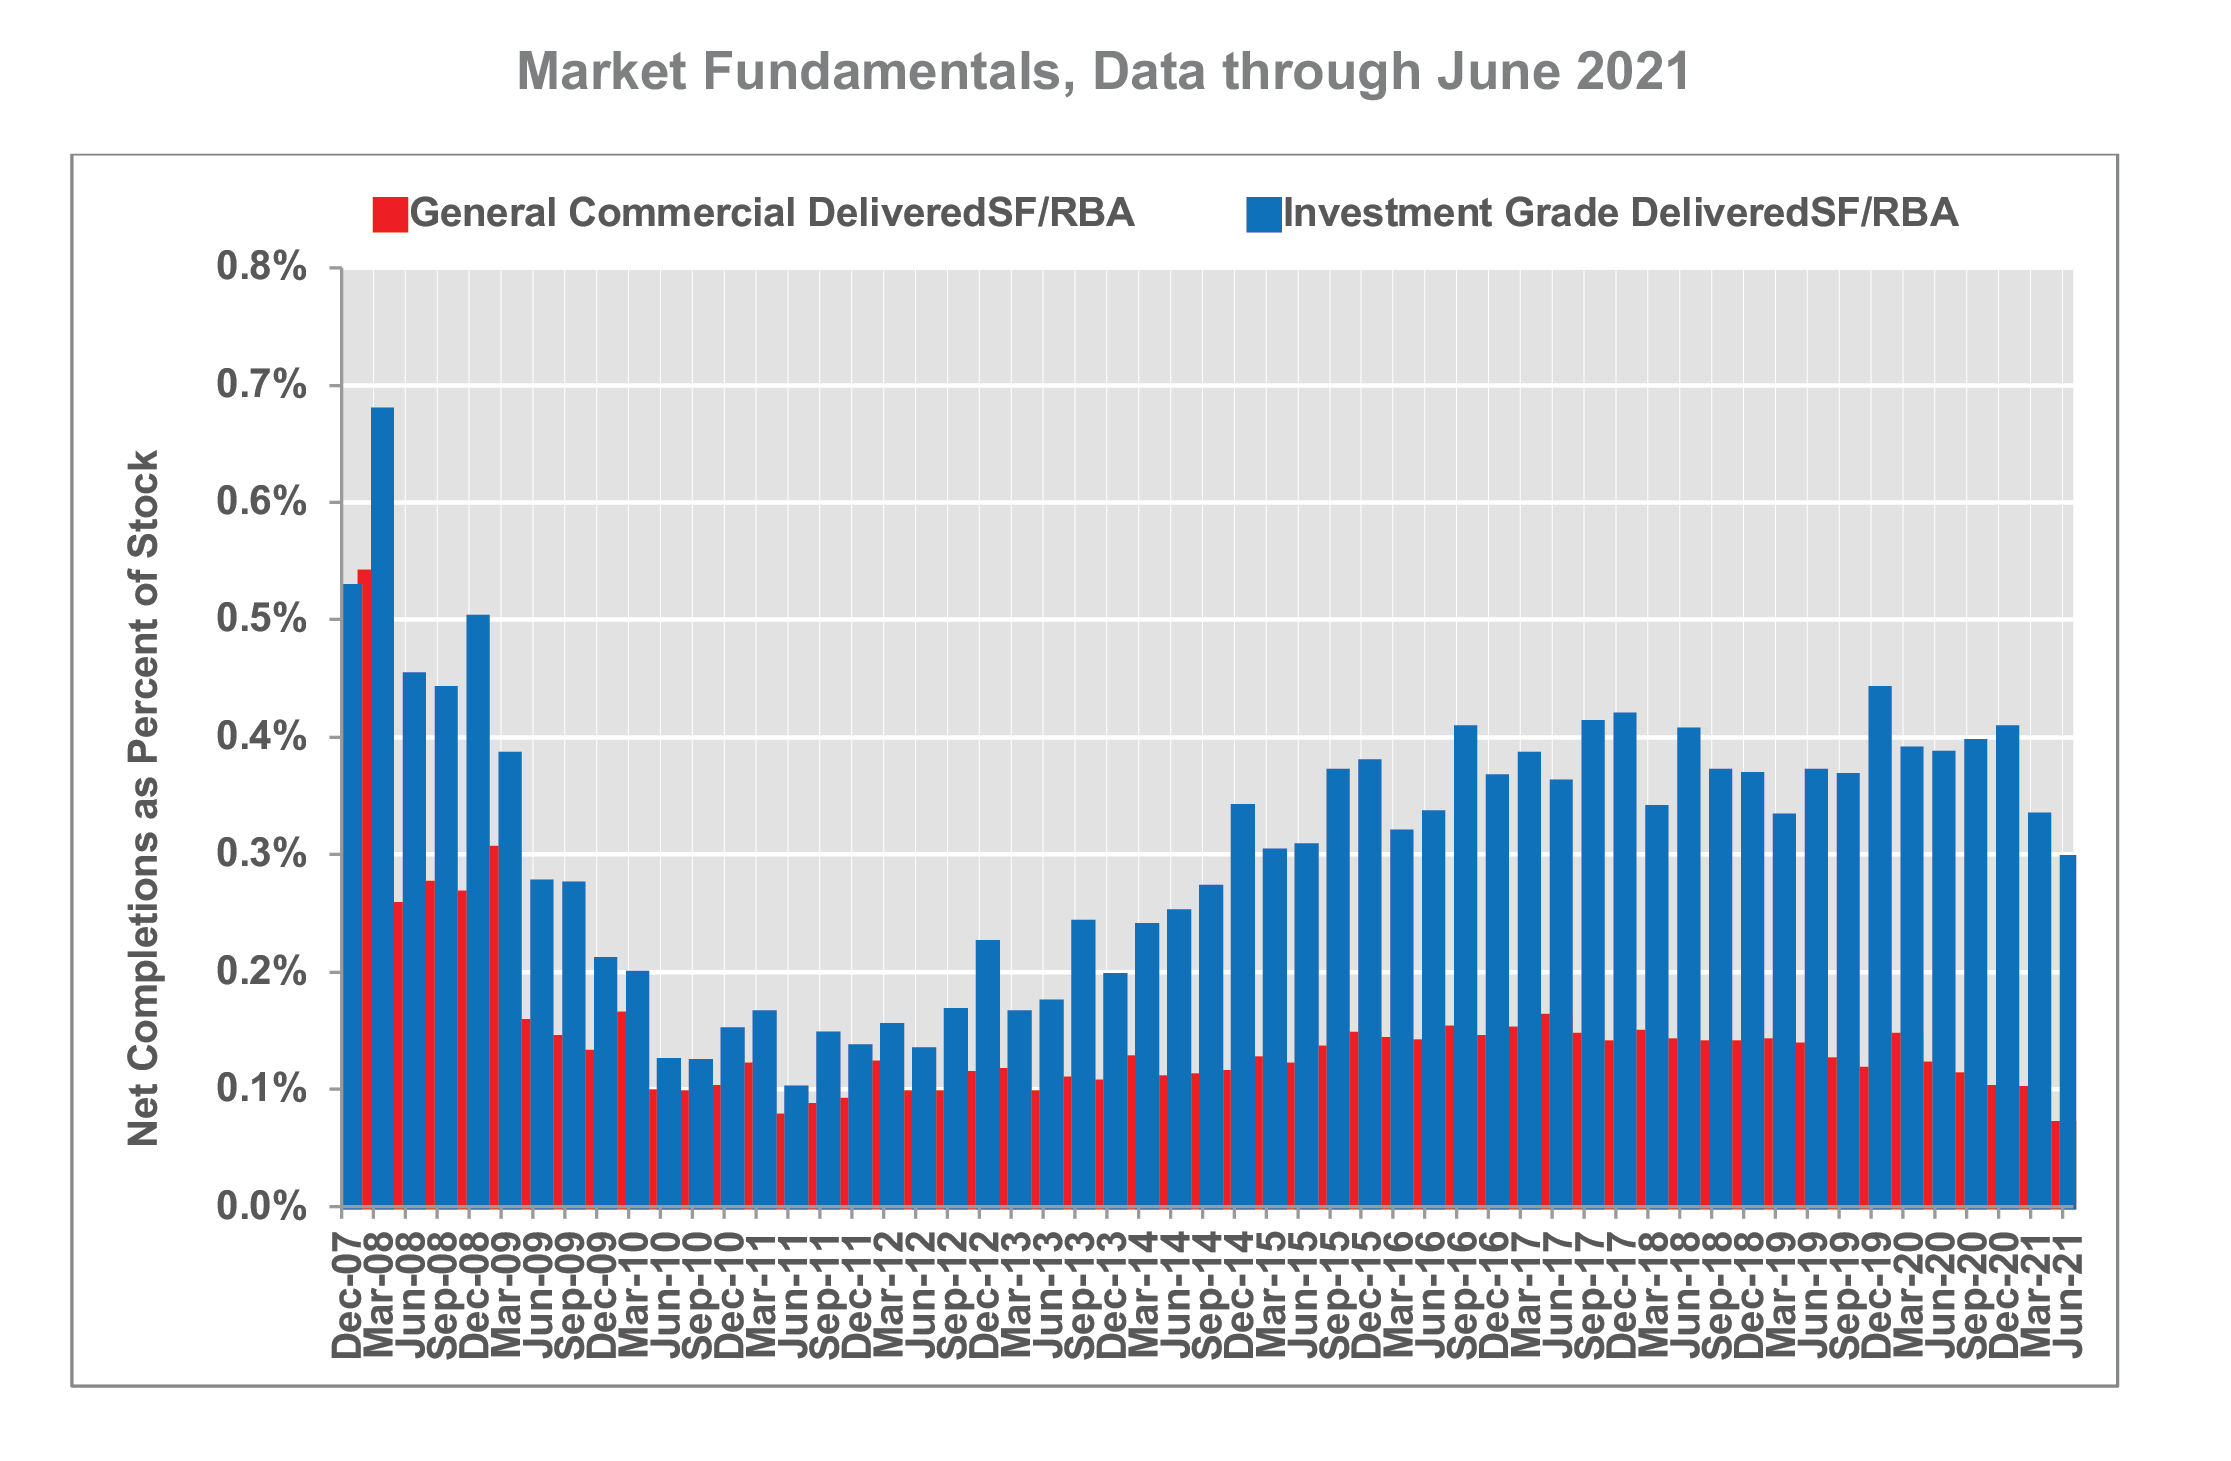
ABSORPTION PROJECTED TO TURN POSITIVE FOR 12-MONTH PERIOD ENDING JUNE 2021. Over the 12-month period ending in June 2021, net absorption for three major property types – office, retail and industrial – is expected to increase by 131.7 million square feet. The anticipated increase represents a shift from negative absorption in 2020 amid the pandemic. Absorption is expected to be roughly evenly split among market segments, with a slight favor to General Commercial, at 70.2 million square feet in net absorption compared to 61.5 million square feet in the Investment Grade segment.
About the CoStar Commercial Repeat-Sale Indices
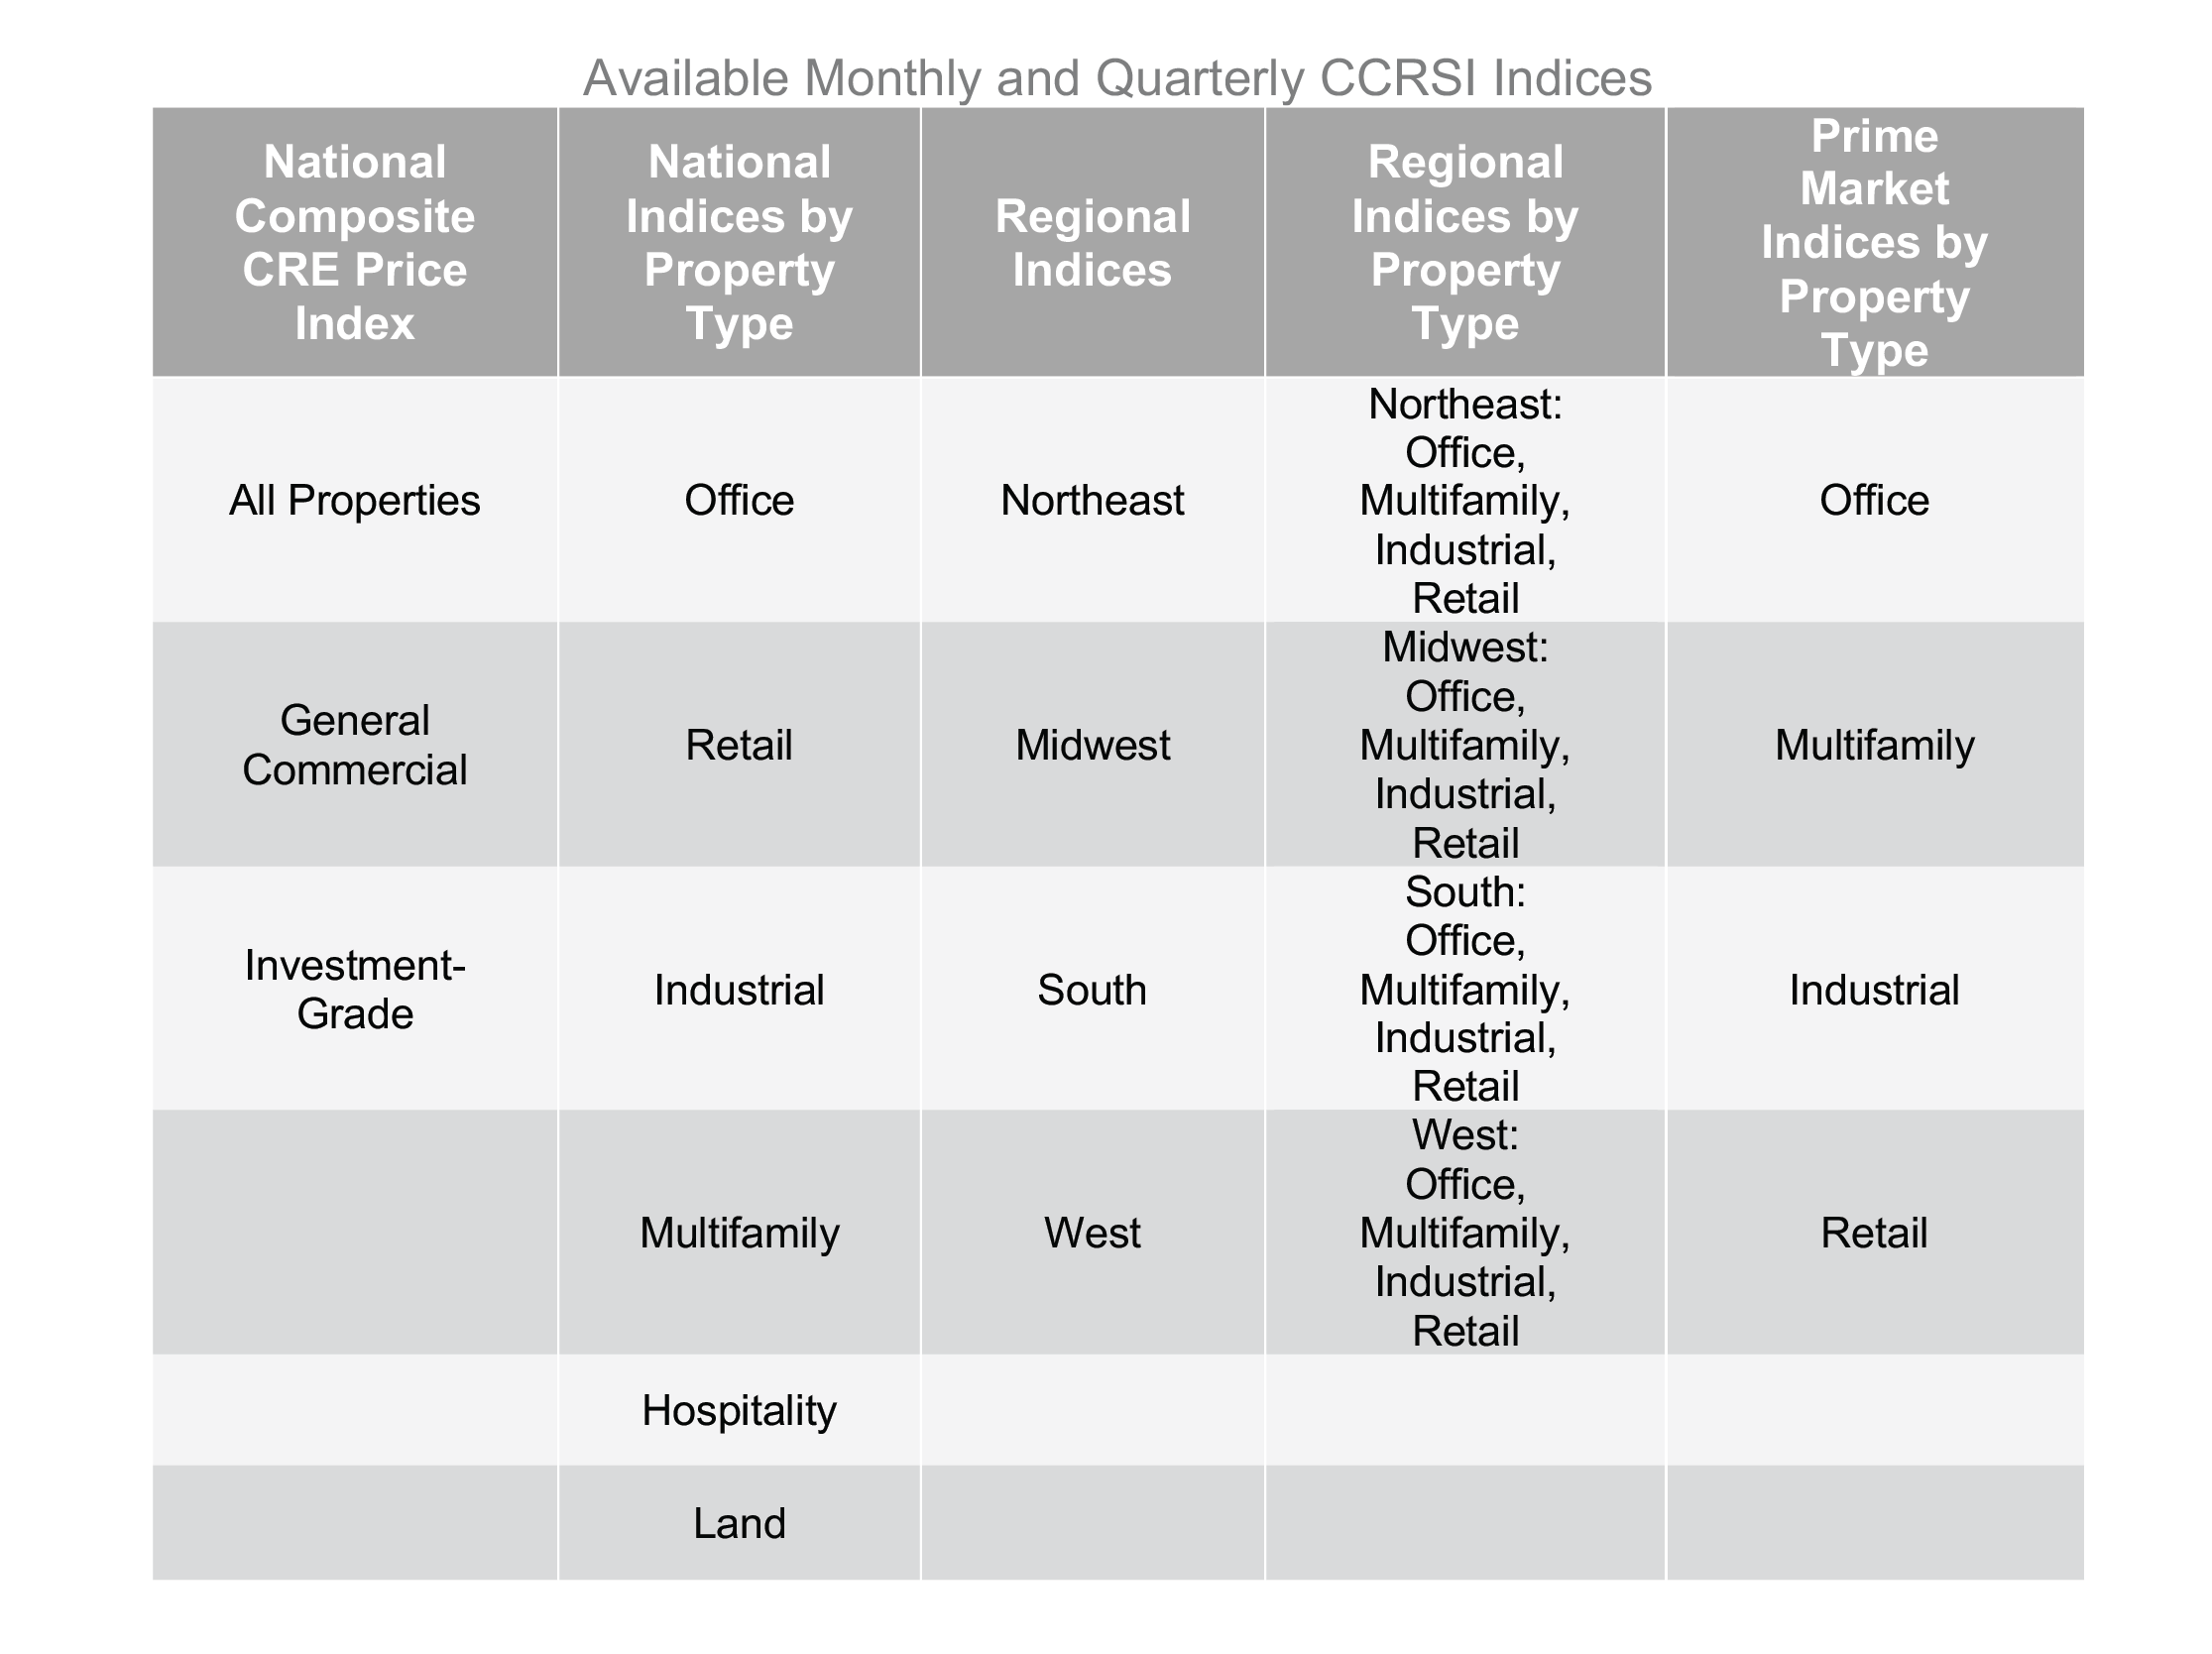
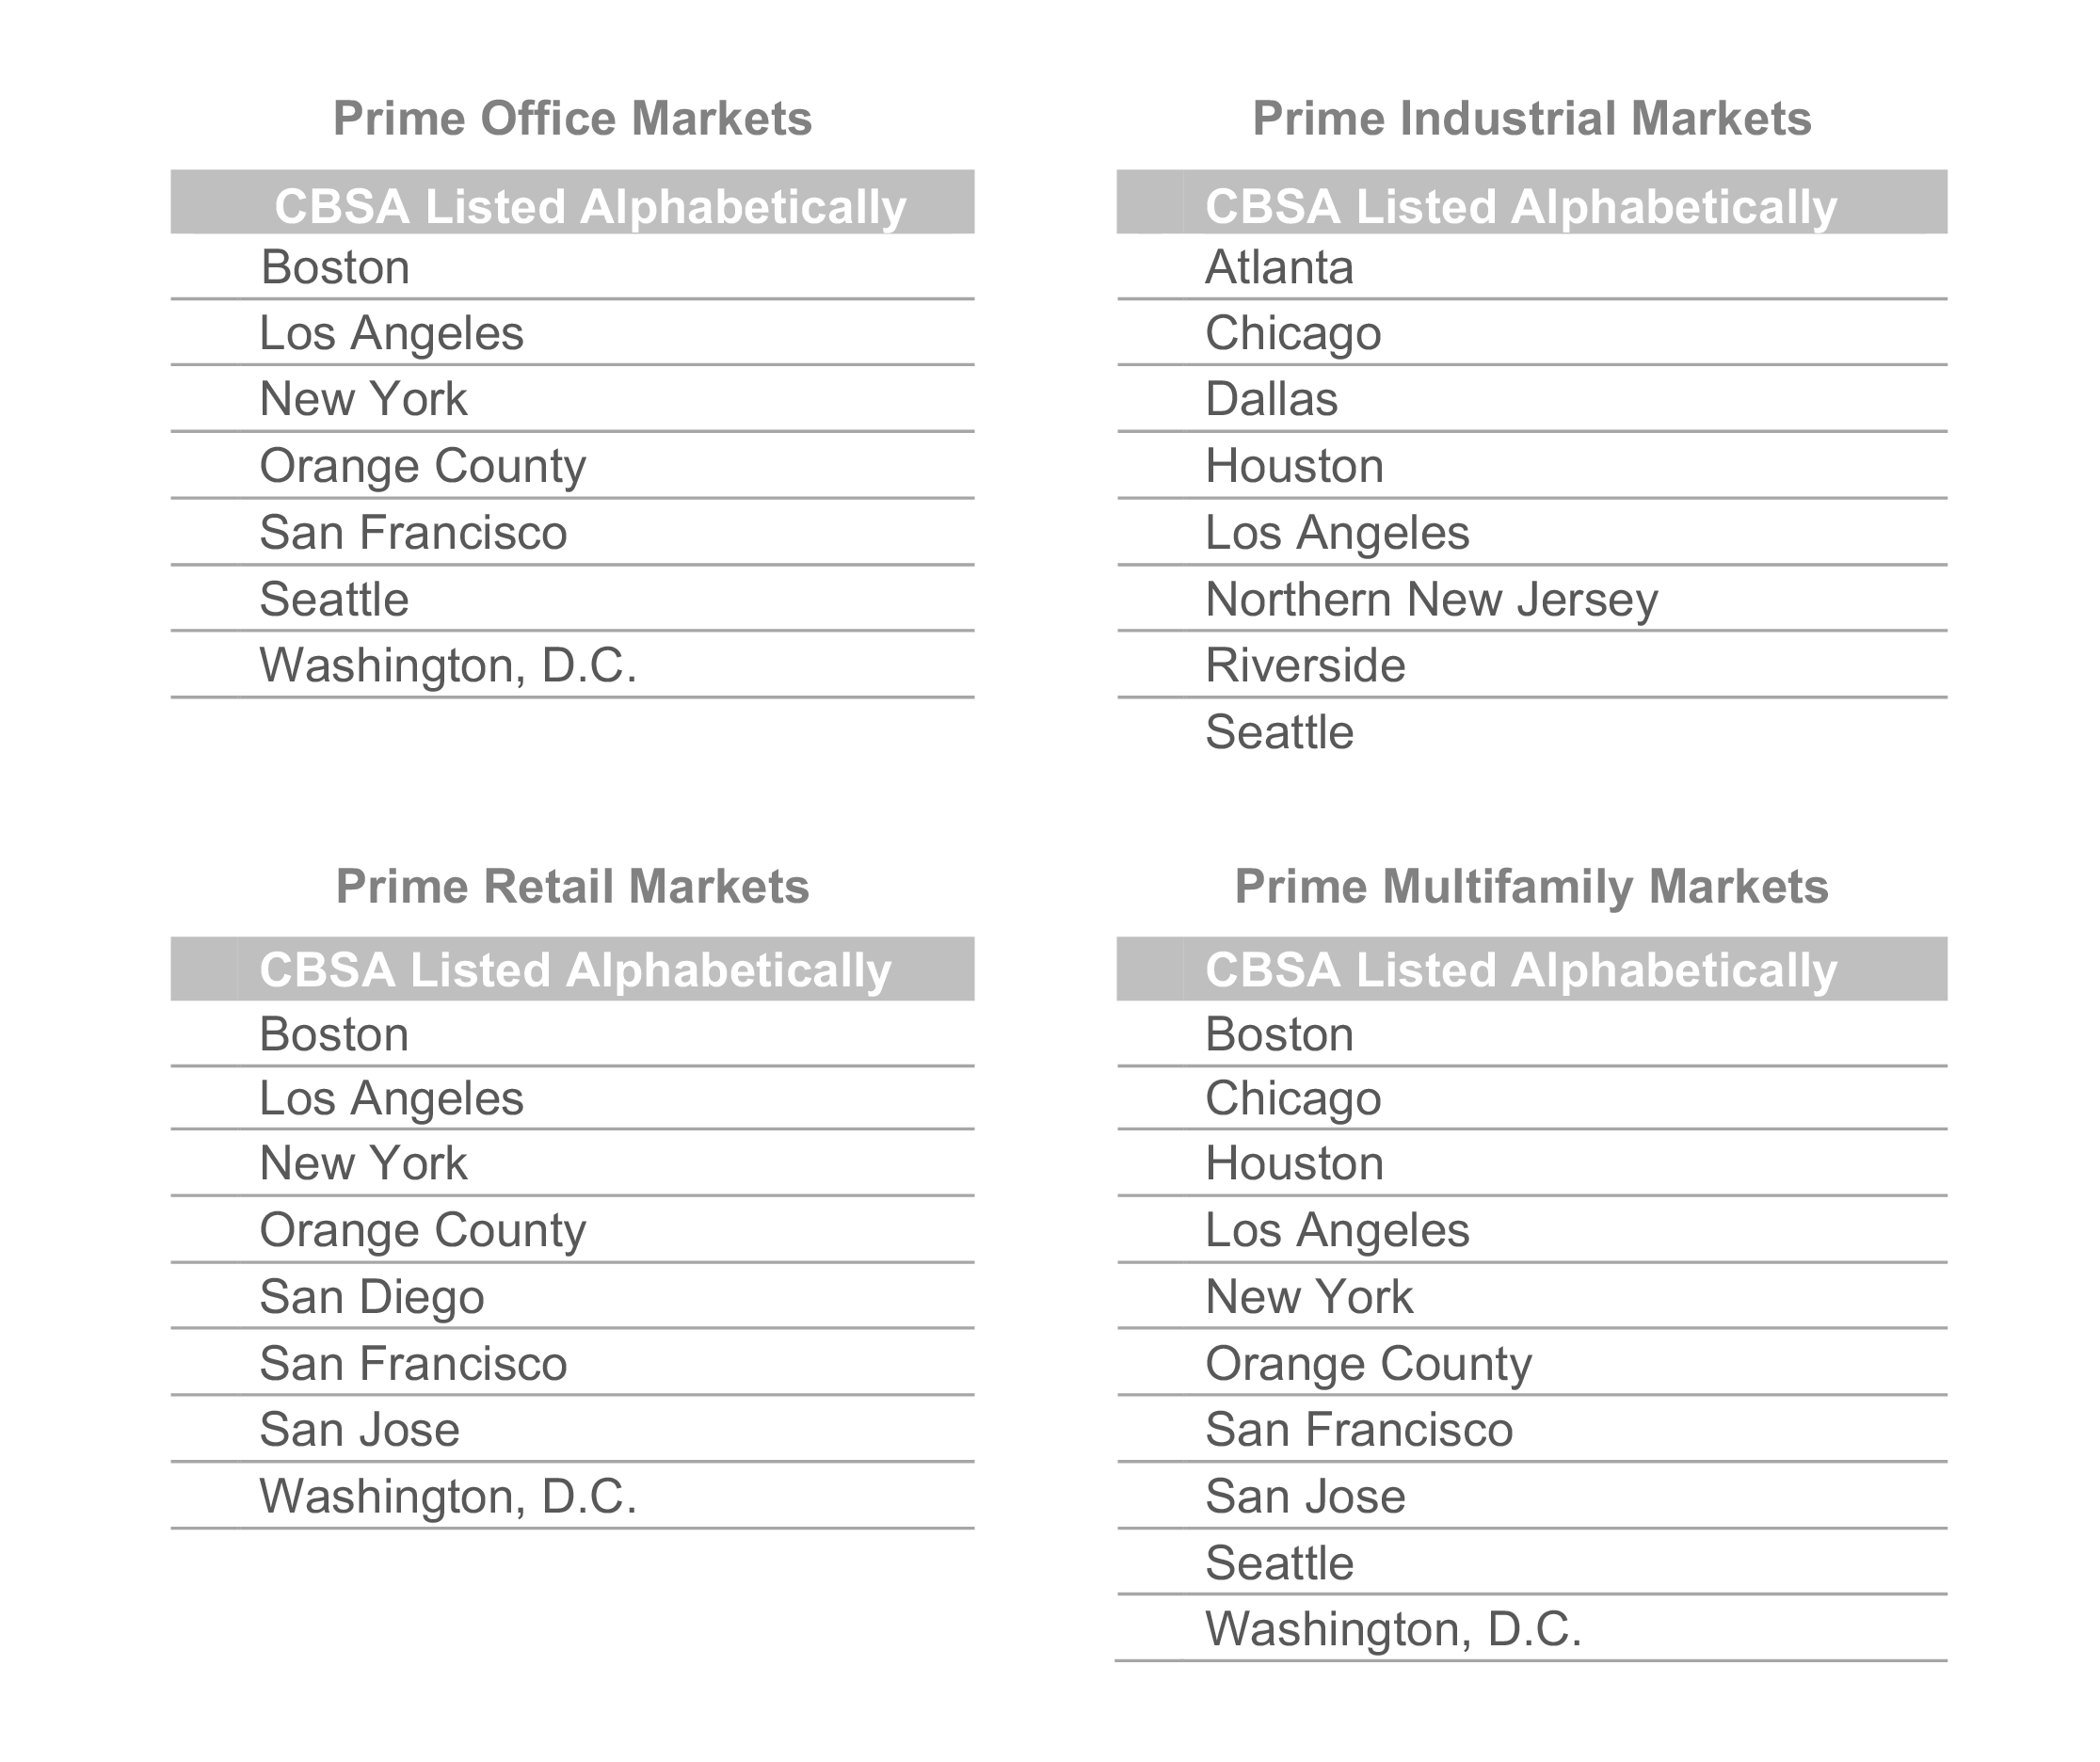
The CoStar Commercial Repeat-Sale Indices (CCRSI) is the most comprehensive and accurate measure of commercial real estate prices in the United States. In addition to the national Composite Index (presented in both equal-weighted and value-weighted versions), national Investment-Grade Index, and national General Commercial Index, which we report monthly, we report quarterly on 30 sub-indices in the CoStar index family. The sub-indices include breakdowns by property sector (office, industrial, retail, multifamily, hospitality, and land), by region of the country (Northeast, South, Midwest, and West), by transaction size and quality (general commercial, investment-grade), and by market size (composite index of the prime market areas in the country).
The CoStar indices are constructed using a repeat sales methodology, widely considered the most accurate measure of price changes for real estate. This methodology measures the movement in the prices of commercial properties by collecting data on actual transaction prices. When a property is sold more than once, a sales pair is created. The prices from the first and second sales are then used to calculate price movement for the property. The aggregated price changes from all of the sales pairs are used to create a price index.
CONTACT:
Gay Beach, Senior Director of Marketing Communications, CoStar Group (gbeach@costargroup.com).
For more information about the CCRSI Indices, including the full accompanying data set and research methodology, legal notices and disclaimer, please visit https://costargroup.com/costar-news/ccrsi.
ABOUT COSTAR GROUP, INC.
CoStar Group, Inc. (NASDAQ: CSGP) is the leading provider of commercial real estate information, analytics and online marketplaces. Founded in 1987, CoStar conducts expansive, ongoing research to produce and maintain the largest and most comprehensive database of commercial real estate information. Our suite of online services enables clients to analyze, interpret and gain unmatched insight on commercial property values, market conditions and current availabilities. STR provides premium data benchmarking, analytics and marketplace insights for the global hospitality sector. Ten-X provides a leading platform for conducting commercial real estate online auctions and negotiated bids. LoopNet is the most heavily trafficked commercial real estate marketplace online. Realla is the UK’s most comprehensive commercial property digital marketplace. Apartments.com, ApartmentFinder.com, ForRent.com, ApartmentHomeLiving.com, Westside Rentals, AFTER55.com, CorporateHousing.com, ForRentUniversity.com and Apartamentos.com form the premier online apartment resource for renters seeking great apartment homes and provide property managers and owners a proven platform for marketing their properties. Homesnap is an industry-leading online and mobile software platform that provides user-friendly applications to optimize residential real estate agent workflow and reinforce the agent-client relationship. Homes.com offers real estate professionals brand and property advertising that connect consumers with real estate professionals. CoStar Group’s websites attract tens of millions of unique monthly visitors. Headquartered in Washington, DC, CoStar maintains offices throughout the U.S. and in Europe, Canada and Asia with a staff of over 4,600 worldwide, including the industry’s largest professional research organization. For more information, visit www.costargroup.com.
This news release includes "forward-looking statements" including, without limitation, statements regarding CoStar's expectations, beliefs, intentions or strategies regarding the future. These statements are based upon current beliefs and are subject to many risks and uncertainties that could cause actual results to differ materially from these statements. The following factors, among others, could cause or contribute to such differences: the risk that the trends represented or implied by the indices will not continue or produce the results suggested by such trends, including trends related to commercial real estate fundamentals, price growth, liquidity measures, and absorption; and the risk that transaction volume, investor demand, market supply, and commercial real estate pricing levels, absorption and growth will not continue at the levels or with the trends indicated in this release. More information about potential factors that could cause results to differ materially from those anticipated in the forward-looking statements include, but are not limited to, those stated in CoStar’s filings from time to time with the Securities and Exchange Commission, including in CoStar’s Annual Report on Form 10-K for the year ended December 31, 2020 and Quarterly Report on Form 10-Q for the quarter ended March 31, 2021, each of which is filed with the SEC, including in the “Risk Factors” sections of those filings, as well as CoStar’s other filings with the SEC available at the SEC’s website (www.sec.gov). All forward-looking statements are based on information available to CoStar on the date hereof, and CoStar assumes no obligation to update or revise any forward-looking statements, whether as a result of new information, future events or otherwise.